
Would you buy something from Amazon if it only had one review? Or go to a restaurant that had just five reviews on Yelp? Maybe, but for many of us, it would feel like a risk. The more reviews, the more confident we tend to feel about the quality of a product or place. That’s because one review is an anecdote, but 50, 100, even 1,000 reviews is data.
If we decide what to buy and where to eat based on data, we should certainly use data to decide where to put resources toward solving social problems. But of course while using data to measure the social impact of a program sounds straightforward, if we misread data or give one data point too much weight, we can end up throwing money away on efforts that don’t create real change. Consider a nonprofit working with the local government to end homelessness in a community. If the nonprofit focuses only on individual stories and doesn’t measure the number of individuals it serves over time, the local government will never know whether the demand for homelessness services is increasing. Even worse, it won’t have the data to know if homelessness in the community is improving or intensifying, which can derail effective resource planning.
Making real social progress means using the right data—and lots of it—to evaluate outcomes, but caveats and misunderstandings abound, even among professionals in the impact measurement arena. Many organizations simply don’t have a clear, evidence-based idea of how or why their programs work, and different organizations have different ideas of what impact measurement entails.
As basic as it might sound, one of the most important elements to understand about claims of social impact is the old adage “correlation doesn’t equal causation.” While correlation, which is simply a relationship between two things, can be a useful endpoint, it’s important to distinguish between a lightly informed decision and an evidence-based one, especially when vulnerable populations and billions of dollars hang in the balance.
Are you enjoying this article? Read more like this, plus SSIR's full archive of content, when you subscribe.
The Spectrum of Impact Measurement
Before making important decisions about allocating resources, organizations need to first identify where a program is, where they want it to be, and how to get it there.
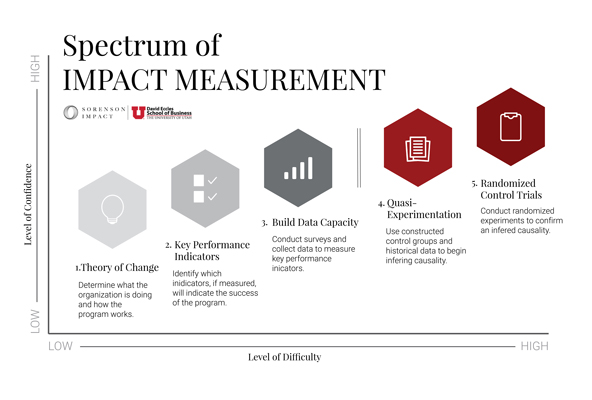 Thinking about measurement on a spectrum can help organizations understand where their current measurement practices stand and outline next steps. (Image courtesy of Sorenson Impact Center)
To aid this process, we developed a Spectrum of Impact Measurement tool with two axes—level of confidence and level of difficulty—and five stages of impact assessment. While the first stage of assessment (determining a theory of change) may be significantly easier than the most advanced stage (conducting a randomized controlled trial, or RCT), on its own, a theory of change won’t provide a high level of confidence in measurement practice. Meanwhile, an organization that is just developing a theory of change will have a much harder time implementing a RCT than an organization that has already identified its key performance indicators (KPIs) and is well on its way to collecting data on them. By breaking down the process into five sequential goals, organizations can take a more “bite-sized” approach to advancing their assessment.
It’s worth noting that there is typically a good reason why an organization’s program assessment is at a particular level, and if it’s on the lower end, it usually isn’t because the organization lacks interest in proving its program works. Moving up the spectrum can be time- and resource-intensive, and many organizations have a limited amount of both.
It’s also worth noting that achieving the experimental methodologies at the very top of the spectrum need not always be the goal. If an organization isn’t pursuing a high level of confidence in its impact, it can gain many insights by simply tracking internal data. A Head Start provider whose goal is to monitor the developmental progress of its children so that it can identify best practices at the classroom level doesn’t need a rigorous study with control groups. However, a Head Start provider pursuing a pay-for-performance contract, where it will get paid only if it can prove that its intervention caused child outcomes, requires a much higher degree of confidence.
 A Head Start provider whose goal is to monitor the developmental progress of its children so that it can identify best practices at the classroom level doesn’t need a rigorous study with control groups. (Photo from on Adobe Stock)
The Five Stages of Impact Measurement
The first three points on the spectrum—logic model, KPI selection, and data collection and analysis—are the social sector equivalents of business analytics. They are not simply prerequisites to experimental evaluations; they are valuable in their own right. Developing these three areas helps organizations build cultures that emphasize the importance of data and information, make informed resource allocation decisions, drive performance through goal-setting frameworks and feedback loops, and ultimately use the information they produce as a strategic asset.
The last two steps are evaluations and involve constructing a control group. Only when there is a control group, or a group similar to existing clients that doesn’t participate in a program, can organizations begin claiming causal inference—that is, confidently claiming that the program is responsible for the change in clients’ circumstance, not merely correlated with it.
Step 1: Theory of Change
A theory of change, or logic model, is the foundation for what an organization does and why it does it. It should answer:
-
What impact do you hope to achieve?
-
What is the mechanism by which you achieve that impact?
-
How will you know when you’ve achieved it?
The second question is where many organizations stumble. Focusing on exactly how a program works, or its “active ingredients,” helps inform later stages on the spectrum. The desired impact of an organization focused on afterschool programs, for example, may be improved school grades, but it may struggle with defining what it’s about the program that leads to better grades. Improved grades might be due to more hours of education, a reduction in exposure to negative home environments, or even parents providing more or better food because they can now work in the afternoons and make higher wages.
To build a strong theory of change, organizations must think through each possible mechanism and consider how their programs intend to achieve impact. Only then can they define appropriate KPIs, set goals, collect data, provide program feedback, and ultimately make decisions more effectively. A theory of change also helps organizations communicate effectively with stakeholders about what their programs are and how they work.
Step 2: Key Performance Indicators
Many social program providers have a requisite set of metrics to track, usually dictated by funders, and sometimes it can be difficult to focus on the important ones. Organizations should determine which metrics actually matter based on their theory of change, focusing on those that are the broadest reaching, provide the most insight into program implementation, and define success, and remembering that sometimes less is more.
Some metrics can be difficult to measure, because they require data from outside an organization. A Head Start provider, for example, may find it challenging to gather data on student test scores once the children are in kindergarten. However, once an organization establishes its “wishlist metrics,” it can identify which of them it already collects and which are within the bounds of possibility. Some readily available metrics will be stepping stones or proxies to wishlist metrics, including simple “counting” metrics, such as the number of people a program serves or client demographics. If Head Start wants to measure kindergarten readiness but can’t get school-district data, a proxy measure would be to assess students’ kindergarten readiness before and after their year in Head Start.
It should be clear who will be responsible for the collection and analysis of data for each metric, what data they need to measure that metric, and where they will store that data. Each metric should also have an associated goal or goals against which the organization can measure progress over time. A workforce development provider’s goal, for example, is to have a certain percentage of enrollees complete its program, and then track progress of that goal. The program should make progress visible to internal stakeholders on a continuous basis and formally review it at set intervals to inform programming decisions. A transparent process demonstrates to front-line staff that the data they’re spending precious time collecting and analyzing is important, and thus helps improve data quality and build a culture that values information and evidence.
 The first three points on the spectrum are valuable in their own right; they help build data-informed cultures, allocate resources, and drive strategies. The last two steps involve constructing a control group; only then can organizations confidently claim that their program is responsible for a change in circumstance, not merely correlated with it. (Image courtesy of Sorenson Impact Center)
Step 3: Data Collection and Analysis
Organizations often have to report on their programs using a specific data collection system dictated by funders or other partners that doesn’t allow them to review the individual-level data they enter into it. For example, some states require that early intervention providers enter client-level survey data, but then do not allow those providers to access it. The state gives the providers an overall score, but doesn’t offer enough detail for the provider to know whether or not they are improving their survey scores for specific populations. In these cases, organizations should set up an alternative system that collects the data they need.
In terms of collecting external data, surveys are the most common method, and a well-designed survey will yield accurate, valid, and reliable information. It can be difficult to design a well-thought-through survey, but depending on the issue area, organizations can look for well-validated ones by searching Google Scholar.
Finally, how organizations use and analyze the data they collect is paramount to improving programs. Collecting time series data (the same data point collected at different points in time) allows them to examine how programs change over time. If a Head Start’s kindergarten readiness scores are improving every year, for example, it indicates that the program outcome is moving in the right direction. Demographic data and survey results can provide insights into which groups benefit from a program over others. If a homelessness provider finds it’s primarily providing services to single individuals rather than families, it can then determine whether to focus on individuals or attempt to adjust to better serve families. Correlations are a powerful sign that a program is either moving outcomes in the right direction or that it’s not having the intended effects and needs changing.
Step 4. Quasi-Experimental Design
Many organizations will be comfortable stopping with correlational data, but without a control group, it’s often hard for an organization to prove that its program is responsible for a given change in outcomes.
When organizations want to claim causal inference using a control group but can’t randomly assign who receives an intervention and who doesn’t, they conduct constructed experiments. Random assignment may be impossible or unethical for many reasons, including in cases where one of the assignments will likely produce a better outcome for the participant. We would never deny hungry families food to create a rigorous experiment. Rather than use random assignment, organizations can find a group of people similar to their clients in several ways.
One option is for an organization to use its own clients as a control group by collecting historical data on the same people as the control. For example, if a workforce development provider wants to track the impact its program had on their clients’ earnings, it could collect earnings data for its clients for the year before they entered the program and compare that to their clients’ earnings the year after they completed the workforce development program. This has many benefits and works for quite a few programs. However, if there are other potential explanations for changes over time, such as changing economic conditions that may impact wages, disambiguating these external factors from the effect of the program is impossible.
Another option is to find a similar group of people who were not able to participate in a program. For example, if 500 people applied for a housing voucher, but an organization had only 100 housing vouchers to distribute, it could collect data on both those who received housing vouchers and those who didn’t, and compare their outcomes. (Note that when resources are limited, the ethical question of not providing services to all who wish to receive them is moot.)
Organizations can also make use of data they already collected for another purpose. A new preschool program, for example, could arrange to receive K-12 data from the school district where it operates. It could then compare the academic outcomes of its preschoolers to the preschoolers in the school district as a whole, while controlling for as many variables as possible.
There are some drawbacks and limitations to the impact an organization can claim when it can’t conduct an RCT. The multitude of considerations is difficult to fully address, and therefore we cannot be as confident that a program is the reason for the change in client outcomes. But done correctly, these methods add weight and confidence to impact measurement over more simplistic, correlational analyses.
Step 5. Randomized Controlled Trial
RCTs have always been considered the gold standard when trying to determine what works. Scientific research has used them for more than 65 years, and they lend organizations the most confidence in their impact. We know that antibiotics treat bacterial infections, for example, because of RCTs conducted in the 20th century.
More recently, it has become best practice to evaluate social programs using RCTs that can be replicated. Multiple RCTs, for example, have shown that the nurse-based home visitation program Nurse-Family Partnership (NFP) reduces child abuse and neglect, and improves cognitive and behavioral outcomes for children. As a result, more local governments and states are funding NFP programs in their own communities.
The keys to designing an RCT are: 1) Each participant has an equal probability of being in either the experimental or control group, and 2) the participants are assigned randomly. So while there may be differences between individuals in each condition, these differences should be randomly distributed and not affect the groups differently. It’s important that the program otherwise treats groups similarly throughout the study period, and that it tracks them based on the same metrics and at the same times to allow comparison.
RCTs are designed to compensate for what some call “the fundamental problem of causal inference.” Put simply, one cannot both do something in the world and observe what would happen if they did nothing. The method is the closest we can get to a time machine, allowing organizations to implement a program and estimate what might have happened if they did not.
One of the largest deterrents to organizations conducting RCTs is cost, especially if a program is in its early stages. When there is a strong desire or need to conduct an RCT, organizations can sometimes partner with an academic institution or professional evaluators to design and manage an RCT from start to finish. Having an outsider conduct the evaluation also assures funders that the conclusions of the evaluation were independently verified.
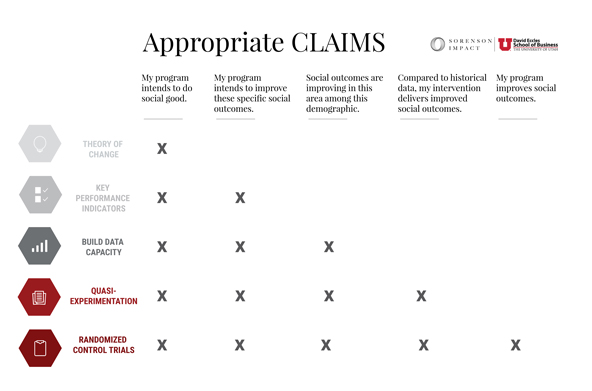
Claiming Impact With Confidence
Once an organization is collecting and analyzing data, it can begin to make claims about its impact. The strength of these claims is limited to correlation when the organization stops at step three, but oftentimes, showing and understanding correlational change is enough to strengthen the organization’s internal feedback loops and satisfy funders.
The last two steps allow organizations to make causal claims of a program’s impact, and they are much easier to accomplish once the first few steps are well developed. Some social programs have no need to conduct a quasi-experiment or RCT, because their programs have been or are already being studied extensively. (The Rigorous Evaluations initiative of the Laura and John Arnold foundation has compiled a thorough catalogue of these.)
In the social sector, impact measurement has been a catchall phrase that often means using easy-to-access data to make big claims. A lack of common understanding about exactly what impact measurement is and what it entails has left many organizations without a playbook for designing and implementing an impact measurement program. The benefit of understanding the spectrum lies not only with the organizations that provide services, but also with the funders who support them. Furthermore, funders who insist that grantees reach the far end of the spectrum need to provide support, financial and otherwise, to achieve the requested level of confidence.
Support SSIR’s coverage of cross-sector solutions to global challenges.
Help us further the reach of innovative ideas. Donate today.
Read more stories by Lisa C. Cox, Nicholas Fritz, Daniel Hadley, Jonathan R. Zadra & Gwendolyn Reynolds.